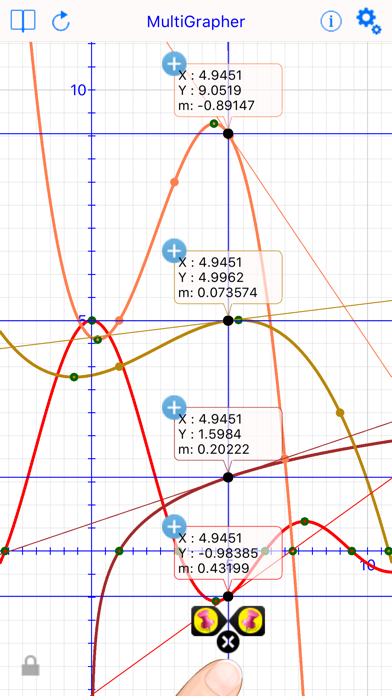
Multi Graphing Calculator app for iPhone and iPad
Developer: Amran AlQasmi
First release : 02 Aug 2018
App size: 45.94 Mb
iMulti Grapher, is of the best graph applications available in the App Store, yet easy to use. it is handy tool essential for doctors, engineers, students and laboratories. Used to both derive the mathematical equation that fits a set or multiple sets of experimental data points, at any required degree, and plot them on graph, Also plot multiple mathematical equations on the same graph. It uses advanced polynomial Interpolation method to plot those data points and draw the derived equation’s curve, and uses advanced expression interpreter to plot the entered math equation’s curves. You can always manipulate the graph interactively (zooming in/out, scrolling and tracking). so you can determine the value of (y) for any given value of (x), plus the slope of the curve at that specific point. also you can get the precise numbers using a dedicated Solver UI. and now you can calculate & visualize area under curve for a given interval. you always can get the derived equations and numerical results in a formatted sheet that can be exported or shared. Minima, maxima & root points are also calculated and represented automatically.
► Features:
- Easy expression entry form, with history.
- Easy Data Points entry form.
- Specialized numeric & function keyboards.
- Controlling graph look & behavior.
- Controlling properties of Pen, Text, Color for both curves & graph.
- Automatic axes Scaling.
- Zoom in/out, scrolling & Tracking.
- Reset Graph, Origin.
- Graph lock.
- Customizable Degree of Interpolation with direct curve redraw.
- Exportable calculations Sheet.
- Interactively & numerically entered limits specification.
- Solver & Solved points collection with auto re-calculation.
- POI points collection with auto re-calculation.
- Live Curve Slope tracking & calculations.
- Precision Control.
- Area under curve presentation & calculations, with interactive tagging.
- Multiple curve handling & tracking.
- Calculate the residual value for each point.
- Calculate the correlation factor.
- Importable Data Points.
- Certified by EAS Organization.


